With the Comparison Graph, the merchants can quickly compare the prices that Amazon and the seller charge for fulfillment. This new graph compares the referral fees, storage costs, and Seller Fulfillment Network fees that Amazon levies. In addition, it enables merchants to alter their prices under the results of their revenue and profit analyses.
With the assistance of this feature, which is made available to Amazon sellers, sellers can improve how they market their products and make better selections overall. Traders interested in increasing their profits while maintaining a competitive edge will find the Comparison Graph handy.
How exactly does the Amazon revenue calculator help sellers determine the pricing of their products?
Merchants who are interested in increasing both their product sales and revenue can create a great use of this calculator. By considering the product’s cost, net margin, net profit, and related income, the calculator tool provided by Amazon gives sellers the assistance they need to establish reasonable prices for their wares. Retailers can access this handy tool, which allows them to compare the fees charged by FBA.
The Comparison Graph feature in the Amazon FBA calculator provides traders an invaluable opportunity to evaluate the fulfillment cost, helping them make better judgments that will improve their Amazon profits.
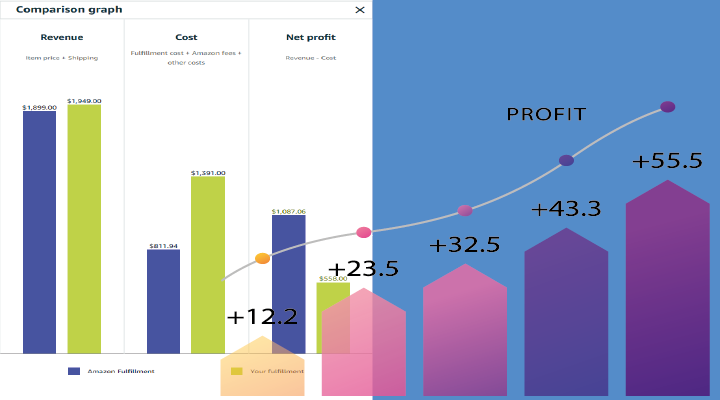
By inputting information into the Amazon revenue calculator, sellers can compare prices between Amazon fulfillment and their fulfillment to determine which will give them the most profit. The fee calculator also displays bar graphs that help sellers visualize their data to quickly and easily change prices and decide more carefully.
Why help sellers use the Comparison Graph in the FBA calculator?
The Amazon revenue calculator now includes a Comparison Graph feature, which helps Amazon traders compare the cost of fulfillment between Amazon and seller fulfillment.
The Comparison Graph allows sellers to view FBA fees associated with selling their product, such as storage fees, Fulfillment By Amazon fees, Seller Fulfillment Network fees, and referral fees. Comparing profit and revenue enables Amazon merchants to decide on product prices more intelligently.
The Comparison Graph is an invaluable tool for sellers looking to optimize their product selling strategy and maximize their profits while remaining competitive in is a new feature that helps merchants on Amazon make wiser decisions, leading to better profits.
Amazon sellers can compare fulfillment costs, check their revenue and profit, modify prices, and visualize their data with the FBA calculator. They can increase Amazon’s income by utilizing this info to make better decisions.
The Comparison Graph provides the following benefits for Amazon merchants:
- The Comparison Graph allows businesses to quickly compare the expenses of seller fulfillment and Amazon fulfillment to see which one is better for them.
- This profit estimate involves all Amazon expenses associated with their products.
- Sellers can use the Comparison Graph to analyze their profit and revenue and modify prices accordingly.
- The Comparison Graph visualizes data with bar graphs that allow traders to optimize their product selling strategy and make decisions that will lead to greater Amazon profits.
- Retailers can stay competitive by comparing prices quickly and accurately with Comparison Graph feature.
- The traders can maximize their revenues while remaining cost-conscious using the Amazon FBA calculator.
- Making data-driven judgments with Comparison Graphs can help traders save time and money.
- They can increase the amount of money they make by using this newest feature to improve their product sales strategy.
Traders can compare the costs of Amazon fulfillment and seller fulfillment using the Comparison Graph feature. Sellers wanting to increase their revenues by optimizing their product sales approach will find this tool helpful. As well as analyze their revenue and profit, adjust prices, visualize data using bar graphs, maintain pricing competitiveness while remaining cost-conscious, save time and money by making quick and precise decisions based on knowledge, and keep up with the competition.
This newest feature to the Amazon FBA Calculator makes it possible to ensure that any option will lead to an increase in Amazon’s earnings.
Denes, with 20 years experience in logistics, holds a Logistics Manager degree from Budapest’s Logistics Association and has penned a thesis on mobile devices. Venturing into e-commerce, Denes specializes in Fulfilled By Amazon and passionately educates others about Amazon selling techniques.